veganism.social is one of the many independent Mastodon servers you can use to participate in the fediverse.
Veganism Social is a welcoming space on the internet for vegans to connect and engage with the broader decentralized social media community.

Administered by:

Server stats:

292
active users

#influxdb

3 posts2 participants0 posts today

J'ai juste un serveur hotspot / #mqtt / #redis / #influxdb / ... en Raspi5, et un vieux portable de récup comme client à tout faire... tout #Debian

Problème je suis à la ramasse en terme de #GPU, et je sens que tout ça fatigue grave.

Ça me chatouille de m'offrir un Jetson Orin Nano Super de #NVidia
- oui : pour une IA locale en gestion #domotique , notamment.

Mais je ne sais pas trop si je vais m'enfermer chez eux, avec tout ce que promet ce "marché"...
Si vous avez une idée sur le sujet, pourriez-vous m'en faire part ? 😅

#IA#Geek#Libre

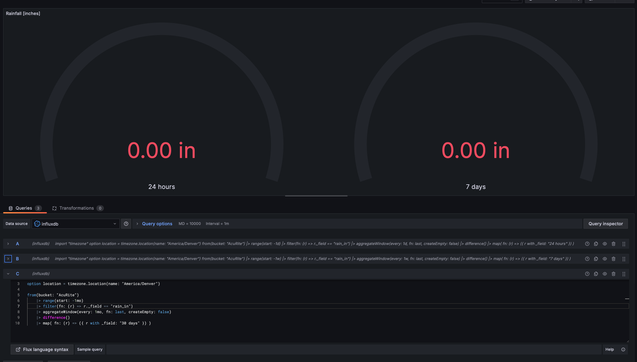
The interaction between Grafana and InfluxDB seems to have a bug on the last day of the month...

My only datapoint is the queries worked fine up to this point but being the last day of the month my "last 30 days" query for rainfall is just...gone...from the gauge dashboard.

#InfluxDB
#Grafana

SSL-Zertifikate überwachen mit Grafana, InfluxDB und Telegraf

Die meisten Entwickler kennen das: Man kümmert sich um zig Dinge gleichzeitig – und dann ist plötzlich wieder irgendein SSL-Zertifikat abgelaufen. Na hoppla!
Um genau das zu vermeiden, habe ich mir ein kleines Setup gebastelt, mit dem ich meine Zertifikate automatisch überwachen kann – visualisiert in Grafana und gespeist durch InfluxDB und Telegraf.
Mehr dazu hier: werkraum.net/devblog/ssl-zerti

Continued thread

One other addition to this problem is I couldn't figure out how to define multiple gauges in one panel and then use variables to change the specific gauge Display name.

Confusingly (maybe) Grafana accesses the data dictionary using the variable:

${__field}

Though nothing will show up in the Display name unless one of the keys is accessed, which seems like a Grafana bug or a bug between the keyboard and chair.

#Grafana
#InfluxDB

Continued thread

The Flux Query Language code I used which would return the amount of rainfall over the past 30 days:

import "timezone"

option location = timezone.location(name: "America/Denver")

from(bucket: "AcuRite")
|> range(start: -30d)
|> filter(fn: (r) => r._field == "rain_in")
|> aggregateWindow(every: 30d, fn: last, createEmpty: false)
|> difference()

#Grafana
#InfluxDB

Ok I think I finally figured out how to have Grafana display a change in data over a period of time. The confusing part is understanding how the Flux Query Language works with a stream of data.

My particular use case is the rainfall amount my weather station transmits is a non-resetting lifetime total. So I need to aggregate the data over a specific window of time to display the amount of rainfall in the last day, week, or month. This set of data works great with a gauge.

#Grafana
#InfluxDB

I've been learning a lot about the rtl-433 library used with an RTLSDR v4 dongle and trying to capture data from my AcuRite 5 in 1 weather station.

Debian 12 currently has the following versions available through the package manager:

librtlsdr-dev (0.6.0-4)
rtl-sdr (0.6.0-4)
rtl-433 (22.11-1)

However, it seems like the driver for the v4 dongle is too old to properly support it. I kept getting the error:

bitbuffer_add_bit: Warning: row count limit (50 rows) reached

#RTLSDR
#RTL433
#InfluxDB